Do you know how much of your maintenance is planned — and how much is a fire drill? For most facilities, the answer is “not enough.” The balance between planned and unplanned maintenance is a clear indicator of how reliable your operation really is.
Planned maintenance percentage (PMP) is a simple way to track the planned vs unplanned maintenance ratio at your facility.
In this article, we’ll quickly outline the differences between planned and unplanned maintenance and discuss the ideal ratio. We will also show how to calculate PMP and present a few strategies to improve it.
What is the difference between planned and unplanned maintenance?
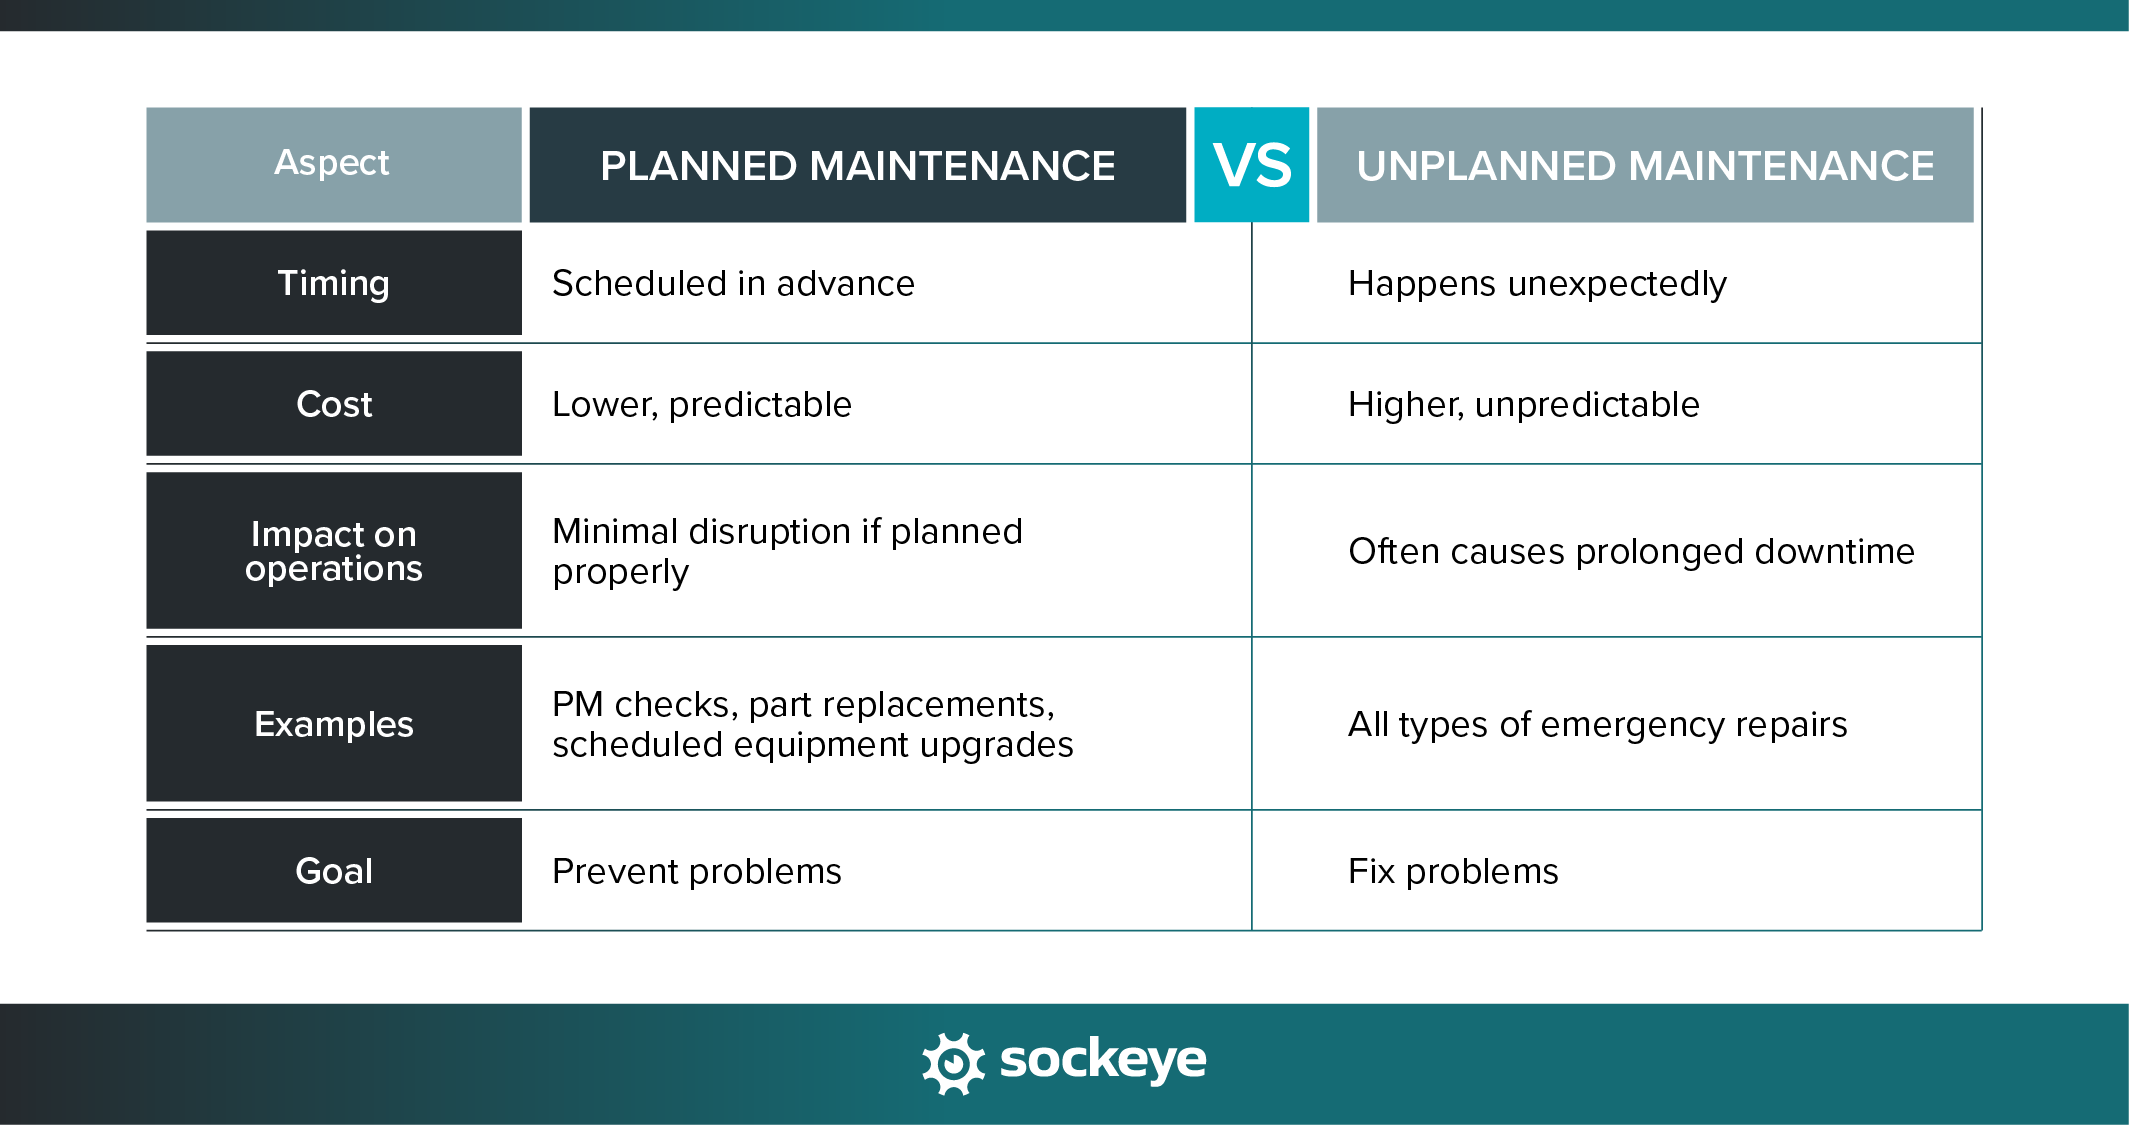
Planned maintenance is any maintenance activity that’s scheduled ahead of time. The goal is to prevent failures, extend asset life, and make downtime predictable instead of chaotic. Typical planned maintenance tasks include routine preventive work (inspections, lubrication, part replacements), scheduled overhauls and upgrades, safety checks and compliance tasks, and similar.
Unplanned maintenance happens when equipment fails unexpectedly, forcing your team to react on the spot. It’s usually more costly and disruptive because it wasn’t on the schedule. Typical unplanned maintenance tasks include emergency repairs, corrective fixes performed during operation, troubleshooting immediately following an equipment malfunction, and other unexpected events your maintenance team is needed for.

What is the ideal ratio between unplanned and planned maintenance?
Most maintenance teams aim to do as much planned work as possible. But in reality, there’s no such thing as zero unplanned maintenance — machines wear out at some point and accidents are bound to happen.
World-class facilities typically keep their Planned Maintenance Percentage at 80% or more, meaning only 10–20% of work is unplanned.
That said, the average maintenance department operates closer to 50–60% PMP, which means they’re still spending almost half their time firefighting. The exception might be industries like utilities that deal with critical infrastructure — their expected PMP is higher since failure can cause safety risks and large-scale disruption.
While the planned vs unplanned maintenance ratio is mostly under your control, several factors make hitting your desired percentage harder:
- Asset age and condition: Older machines are more unpredictable and prone to failure. In fact, in a 2021 Plant Engineering study, 42% of plants reported ageing assets as the leading cause of unscheduled downtime.
- Workforce skills and training: Poorly planned, scheduled, or performed PMs will not reduce equipment breakdowns. Your team needs tools, training, and standardized procedures.
- Labor shortages: When you don’t have enough technicians, planned jobs get pushed back, and small issues are left to snowball into emergency repairs.
- Lack of scheduling tools: Excel spreadsheets and clunky CMMS/EAM modules make it hard to schedule and stay on track with preventive work. You can fix that with a simple maintenance scheduling bolt-on like Sockeye.
- Organizational culture: If leadership sees maintenance as strategic, planning gets prioritized. If it’s treated as a cost center, teams often remain stuck in the reactive cycle.
The cost of planned vs unplanned maintenance
Your planned vs unplanned ratio has a direct impact on both costs and reliability. Planned maintenance is an upfront investment, and it’s far cheaper than constantly putting out fires:
- Direct costs: Unplanned work often means paying extra for rush shipping, overtime labor, and emergency contractor support. Planned jobs, on the other hand, can be scheduled during regular shifts with parts ordered at standard rates.
- Indirect costs: Downtime caused by unexpected failures ripples across production schedules, customer orders, and even safety. Planned work can usually be done during scheduled shutdowns or slow periods, minimizing disruption.
What is a Planned Maintenance Percentage (PMP)?
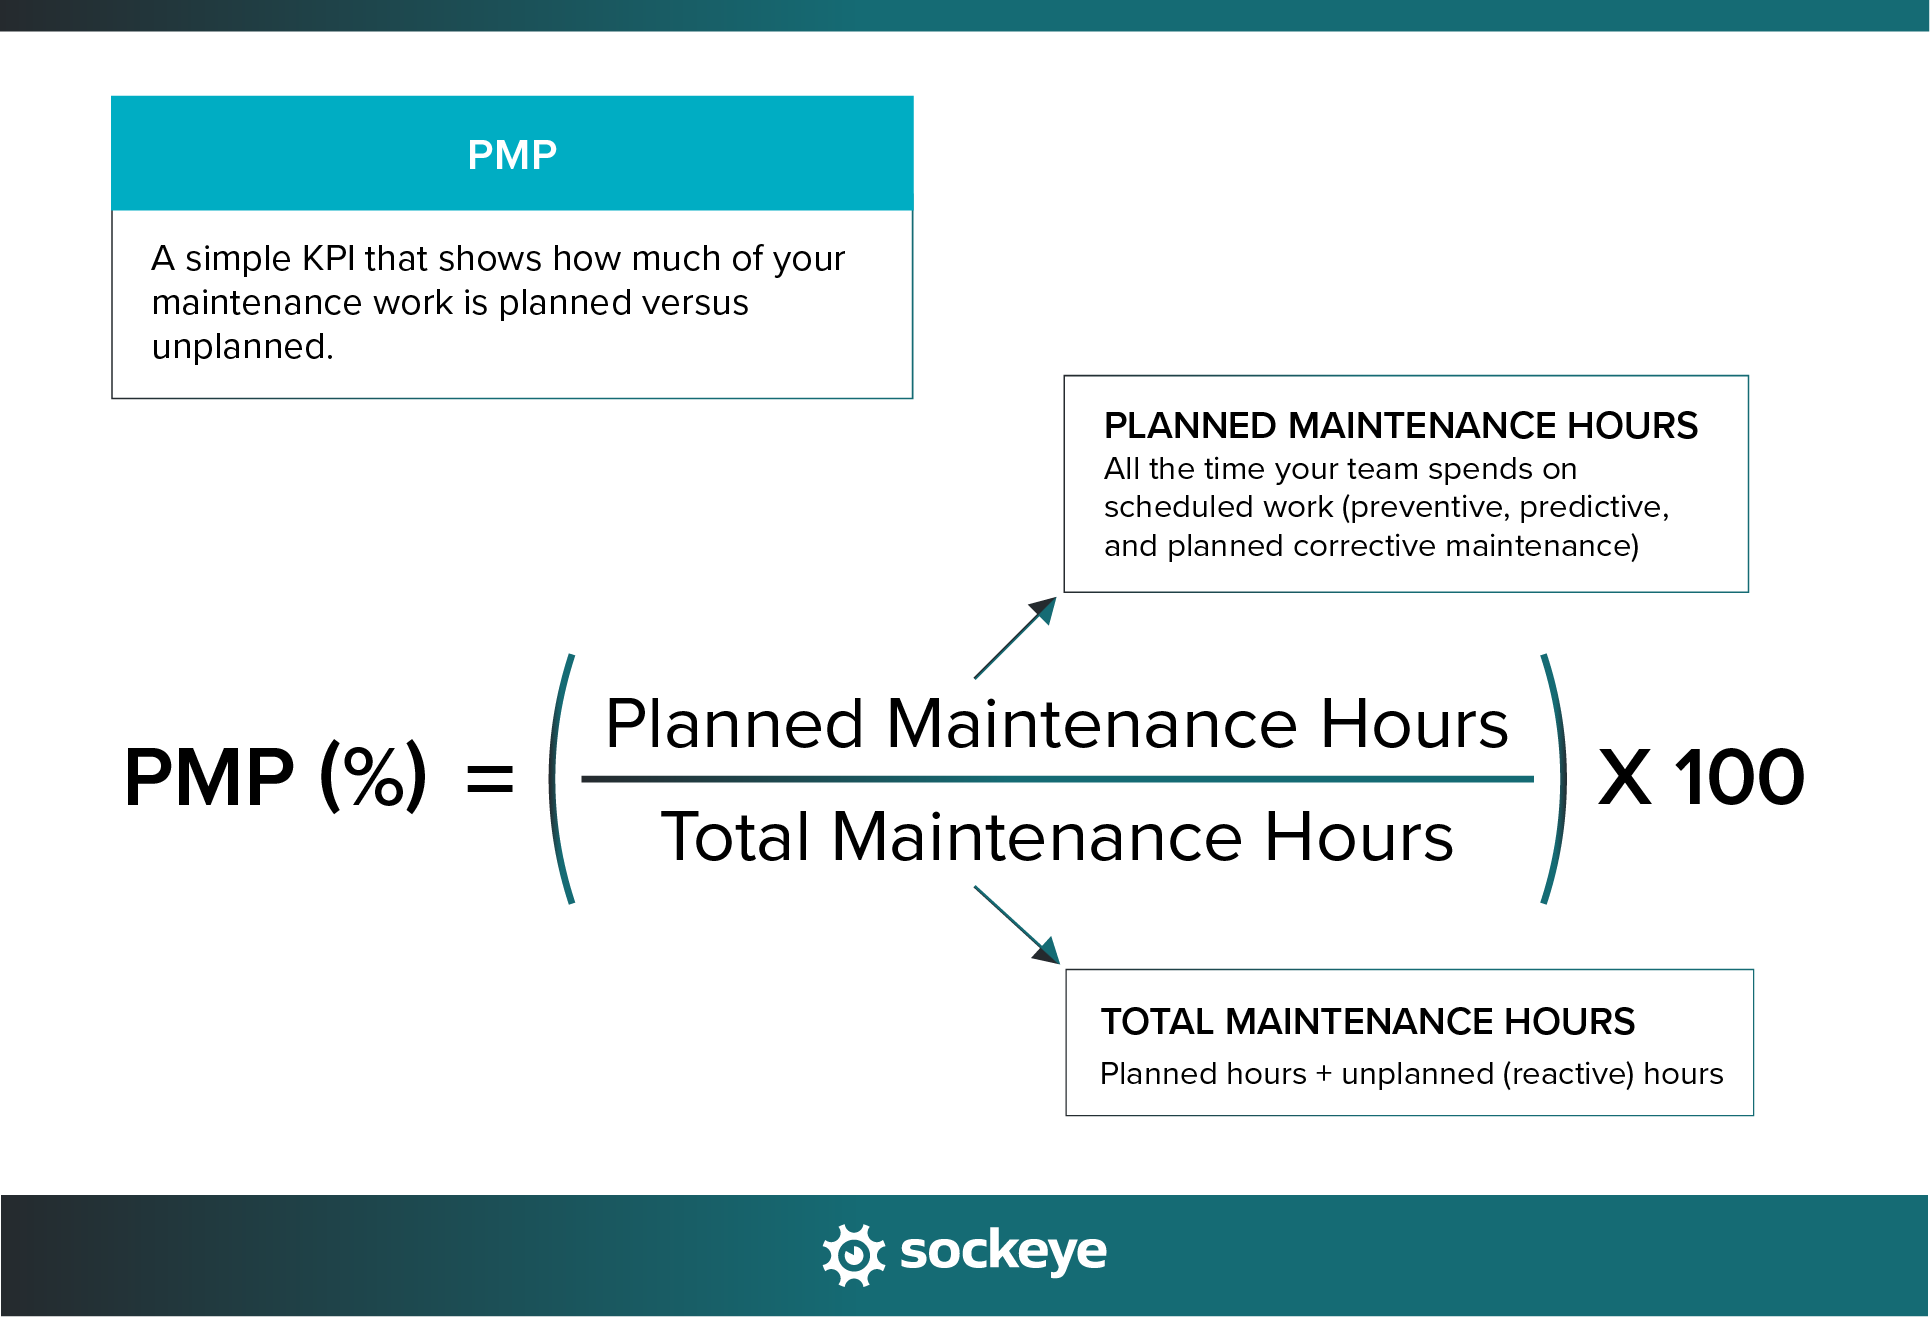
Planned Maintenance Percentage (PMP) is a simple KPI that shows how much of your maintenance work is planned versus unplanned. It’s expressed as a percentage, making it easy to track over time and compare across teams or facilities.
A high PMP indicates that your maintenance program is proactive, your assets are more reliable, and your team spends less time on emergencies.
A low PMP means that a big chunk of your maintenance work is reactive. This usually signals unreliable assets, weak planning, or a lack of resources.
PMP works best as a regularly tracked scheduling KPI. Many teams calculate it:
- Weekly – for a close-up view of trends and quick course corrections.
- Monthly – to spot broader patterns without getting lost in short-term noise.
- Quarterly – for executive-level reporting and long-term planning.
The key is consistency. Track PMP the same way each time so you can see whether your improvement efforts are paying off.
PMP formula and calculation example
Here is the PMP formula:

PMP CALCULATION EXAMPLE:
Let’s say your maintenance team logged 2,000 total hours of work in a month. Out of those, 1400 hours were spent on planned maintenance, and 600 hours were spent on unplanned work.
PMP = (1400 ÷ 2,000) × 100
PMP = 0.7 × 100
PMP = 70%
That means 70% of your team’s work was proactive, while 30% was reactive. If your goal is 80–85%, you now have a clear target for improvement.
How to improve PMP (do more planned than unplanned work)
The goal isn’t to eliminate unplanned maintenance completely — that’s impossible. Instead, the aim is to minimize it so your team spends most of its time on scheduled, proactive work. Here are some proven ways to boost your PMP:
- Implement preventive and predictive maintenance programs: Moving away from reactive to proactive maintenance strategies will increase your PMP — by definition.
- Use condition monitoring tools: Vibration analysis, oil analysis, and temperature sensors give you early warnings to prevent failures.
- Improve planning & scheduling practices: Use tools like Sockeye to consistently create realistic equipment maintenance schedules based on real-time labor availability.
- Train technicians to follow standardized workflows: SOPs, checklists, and digital workflows ensure consistent work and prevent errors that lead to reactive fixes.
- Track KPIs and drive continuous improvement: Regularly monitor PMP alongside other metrics like schedule compliance, MTBF, and backlog to measure progress and fine-tune your strategy.
- Find and eliminate root causes of failures: Go beyond quick fixes with root cause analysis (RCA) to stop recurring problems and reduce unplanned work. Inform your RCA process by using Sockeye to mark down the reason when any work order is delayed.
Track your planned vs unplanned maintenance ratio with Sockeye
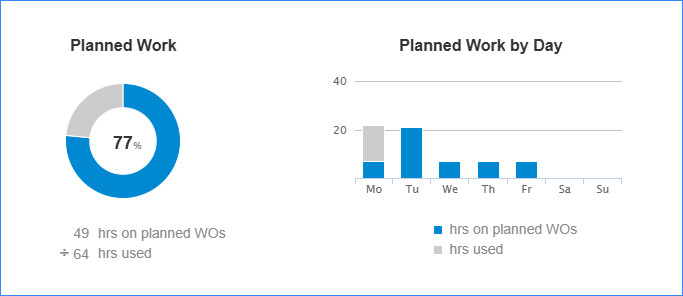
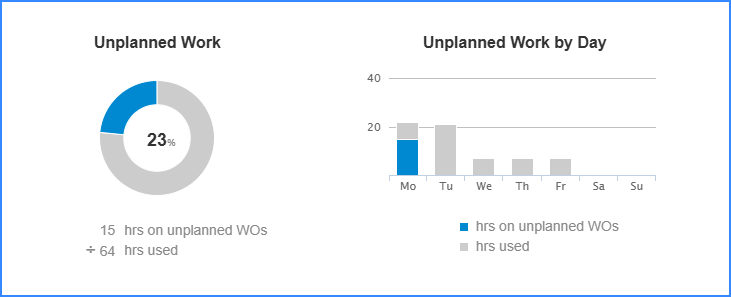
To improve your planned vs unplanned maintenance ratio, you first need to see what your baseline is. Your maintenance scheduling tool should be able to calculate that number for you automatically, based on the type of work orders (planned or unplanned) you schedule and the time required to complete them.
Here’s how these simple reports look in Sockeye:


You can also set up PMP as a custom KPI and generate reports automatically for different stakeholders. Or forward all of the Sockeye data to any business intelligence tool you might be using.
Test Sockeye using the free trial. We can show you how it works without involving your IT department. Don’t miss the opportunity to get a proof of concept without spending a single cent.