Smart maintenance decisions don’t just happen — they’re built on solid data. Whether you’re figuring out your budget, deciding on new tech, or fine-tuning your maintenance strategy, having the right maintenance statistics can make all the difference.
It’s one of the reasons we put this article together.
We rolled up our sleeves and dug into the latest maintenance research (and now the whole industry has our email address). Over the past few years, industry reports or surveys were fairly scarce — but we sifted through everything we could find.
Our focus was on reports from reliable sources in industrial maintenance. All of the data we share below was published in the last five years (2020 or newer).
To make things easy to navigate, we’ve organized the stats into six categories:
- General Industry Stats – big-picture trends that affect everyone.
- Preventive Maintenance – what’s working and what’s changing.
- Predictive Maintenance – insights into where the future’s headed.
- Technology Adoption – who’s using what now, and where they plan to invest next.
- Budgets and Costs – how much are plants spending on maintenance in proportion to their operating budget.
- Manufacturing Maintenance – statistics at the interaction of maintenance and manufacturing, focusing on machine downtime.
So whether you’re looking to benchmark your performance or just stay in the loop, you’re in the right place.
How to use this data
Some of the ways you can put this data to work:
- Benchmark your department: See how your team or department compares to industry averages.
- Spot trends: Stay on top of what’s gaining momentum — or losing steam.
- Guide investments: Use the data to help decide where to put your time, money, and resources.
- Support your strategy: Back up your decisions with real-world stats.
- Cite in reports or articles: Need a relevant maintenance statistic for your latest content piece that is not from 1985? Feel free to reference this piece!
Now let’s get into the stats!
General industry stats
Even with all the new tools, strategies, and tech upgrades, maintenance teams are still grappling with some stubborn, long-standing challenges. Here, we threw interesting stats that were not a good match for any other category.
One stat that stands out:
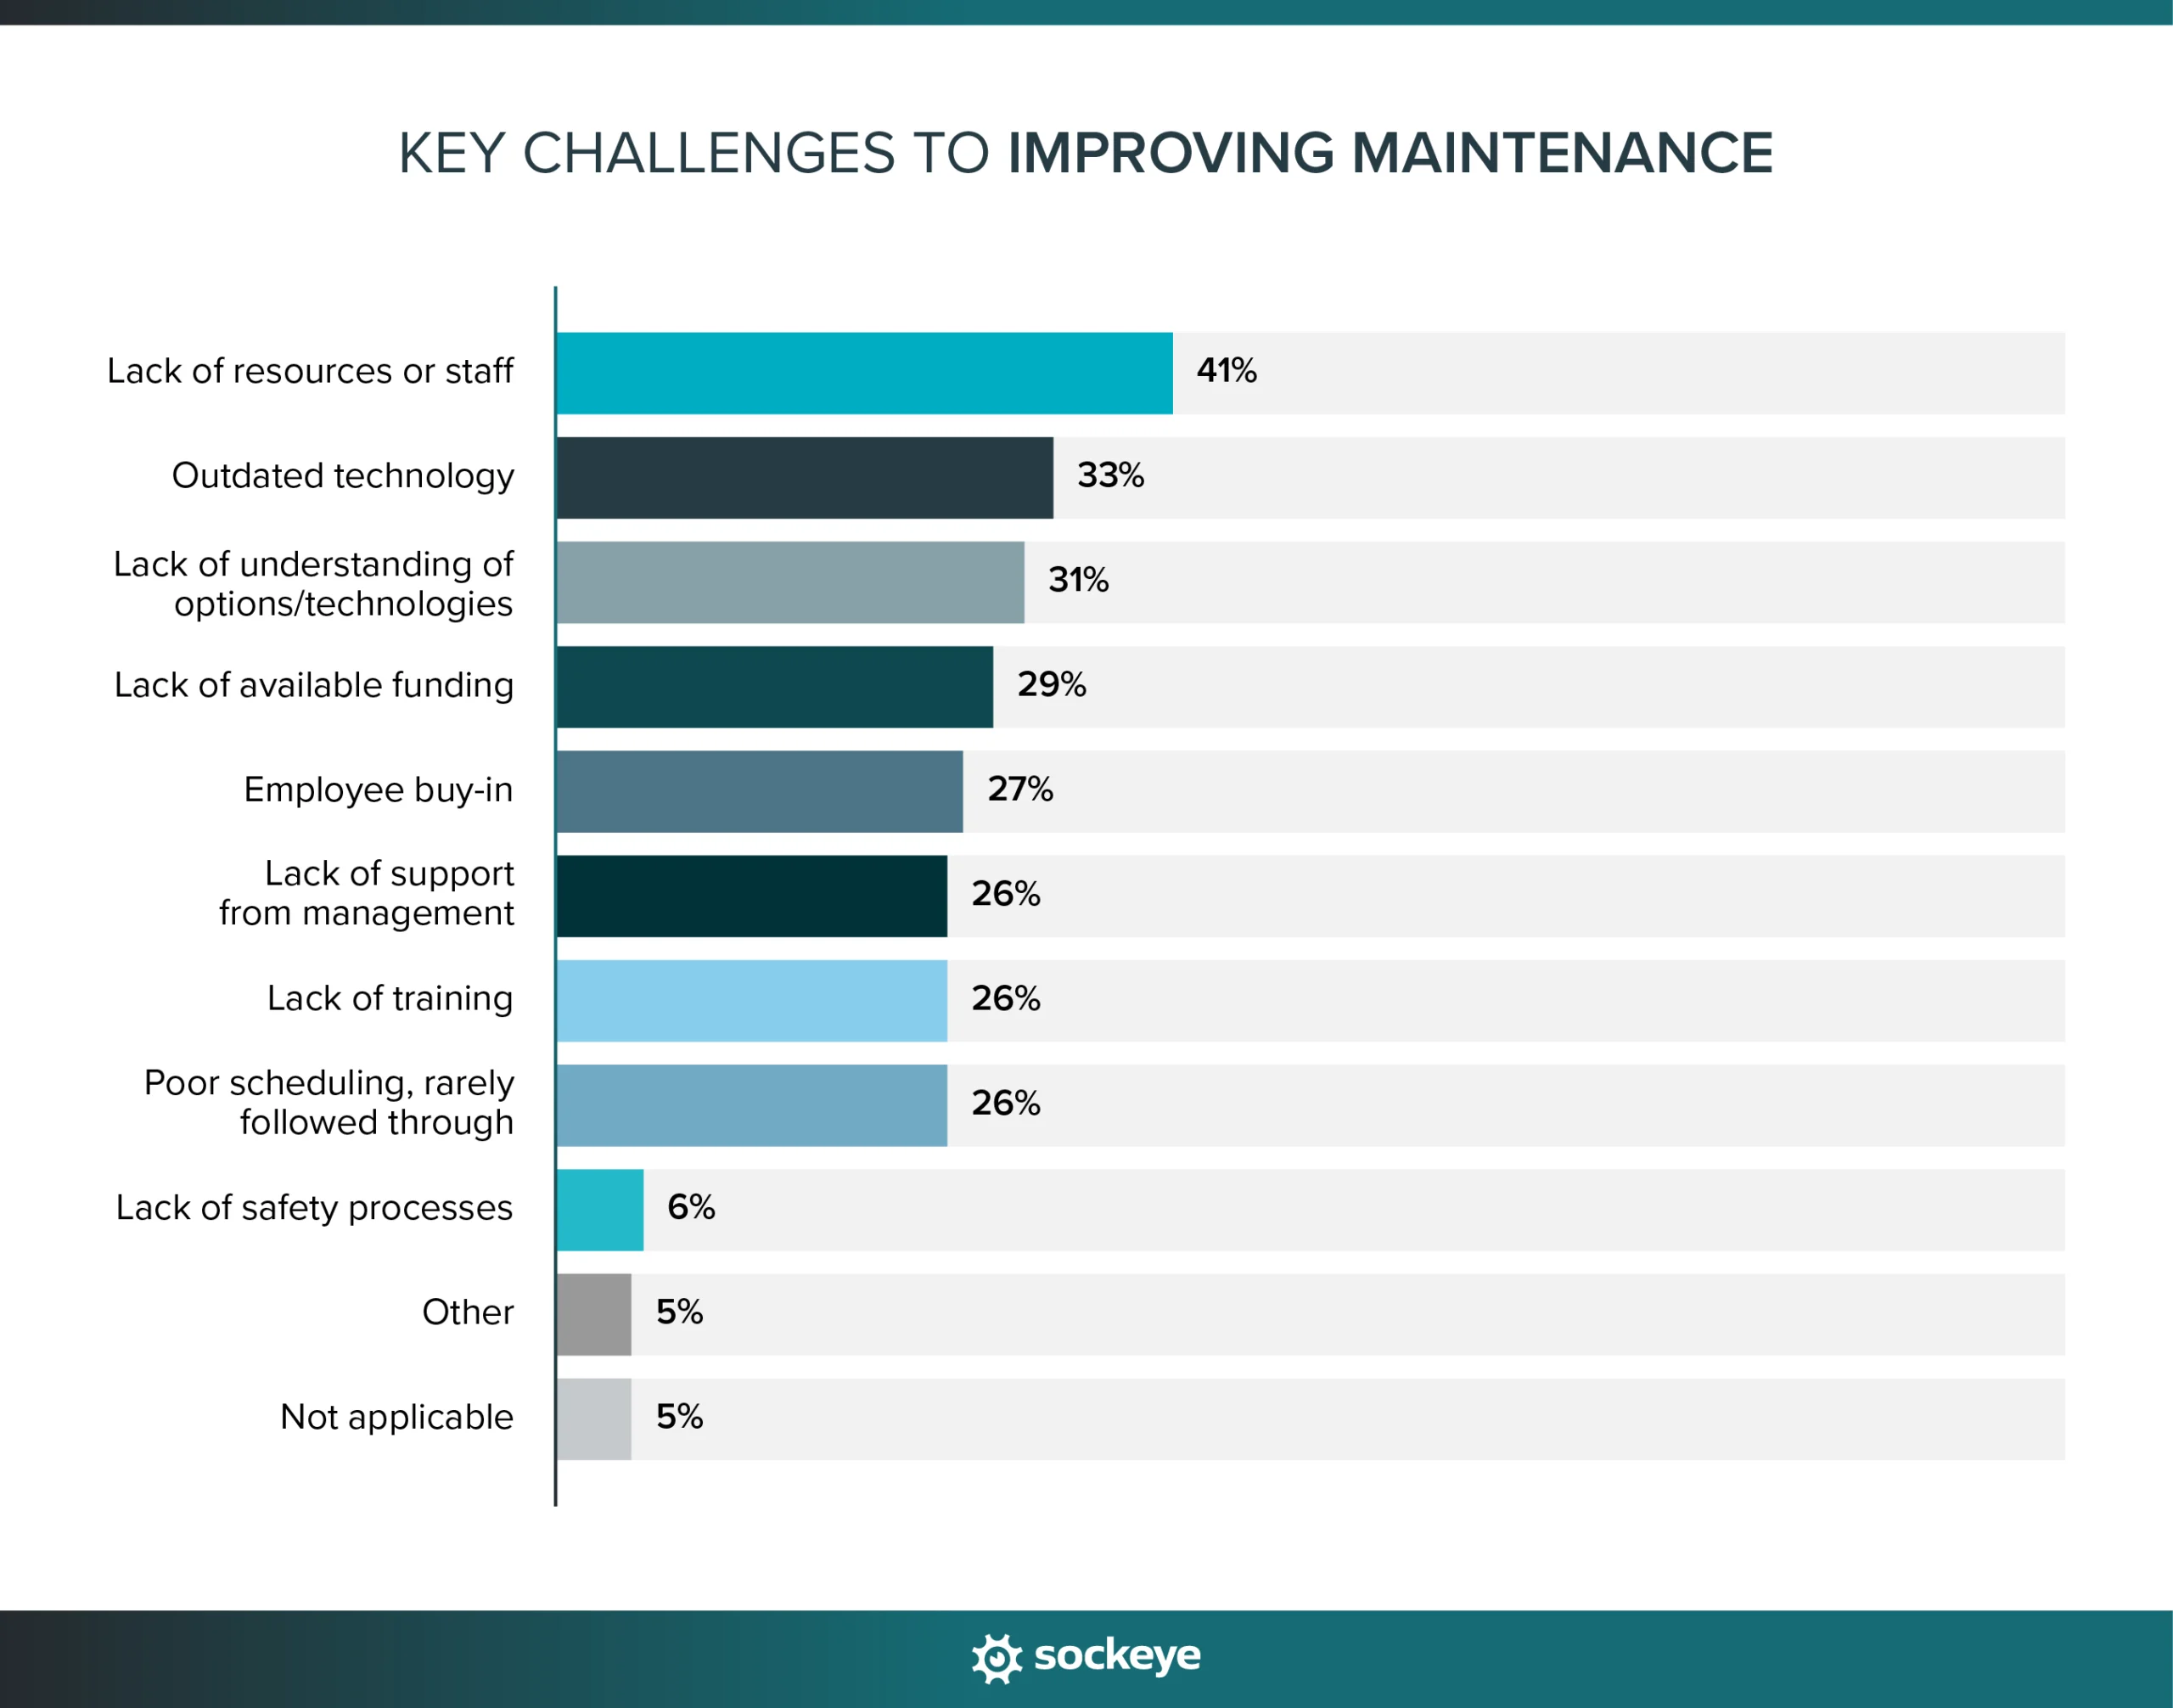
41% of manufacturers report that the lack of resources or staff is their biggest challenge. Combine that with aging equipment, and you have a one-two punch that hits hard. Older machines demand more maintenance, but fewer skilled people are around to take care of them.
Other general stats from the maintenance industry:
- 88% of plants outsource some or all of their maintenance operation. Top reasons for outsourcing include having an agreement in place with a manufacturer/supplier (44%), a lack of skills among staff (40%) and a lack of time or manpower to dedicate to maintenance (39%).
- 32% of maintenance leaders see maintenance as a profit center. 22% think it is a cost center that will become profitable through predictive maintenance. The last 46% think it is a cost center that provides value through improved uptime.
- The top challenges to improving facility maintenance are aging equipment (67%), a lack of understanding of new options and technologies (37%), a lack of resources or staff (34%), and outdated technology (34%).
- 77% of manufacturers rely on OEMs, suppliers and vendors to provide the information necessary for maintenance management. Other top sources include training classes (46%) and trade publications (44%).
Preventive maintenance statistics
Preventive maintenance is still the backbone of most maintenance programs. The following stats show how widely PM is used and how it actually plays out in day-to-day operations.
One stat that stands out:
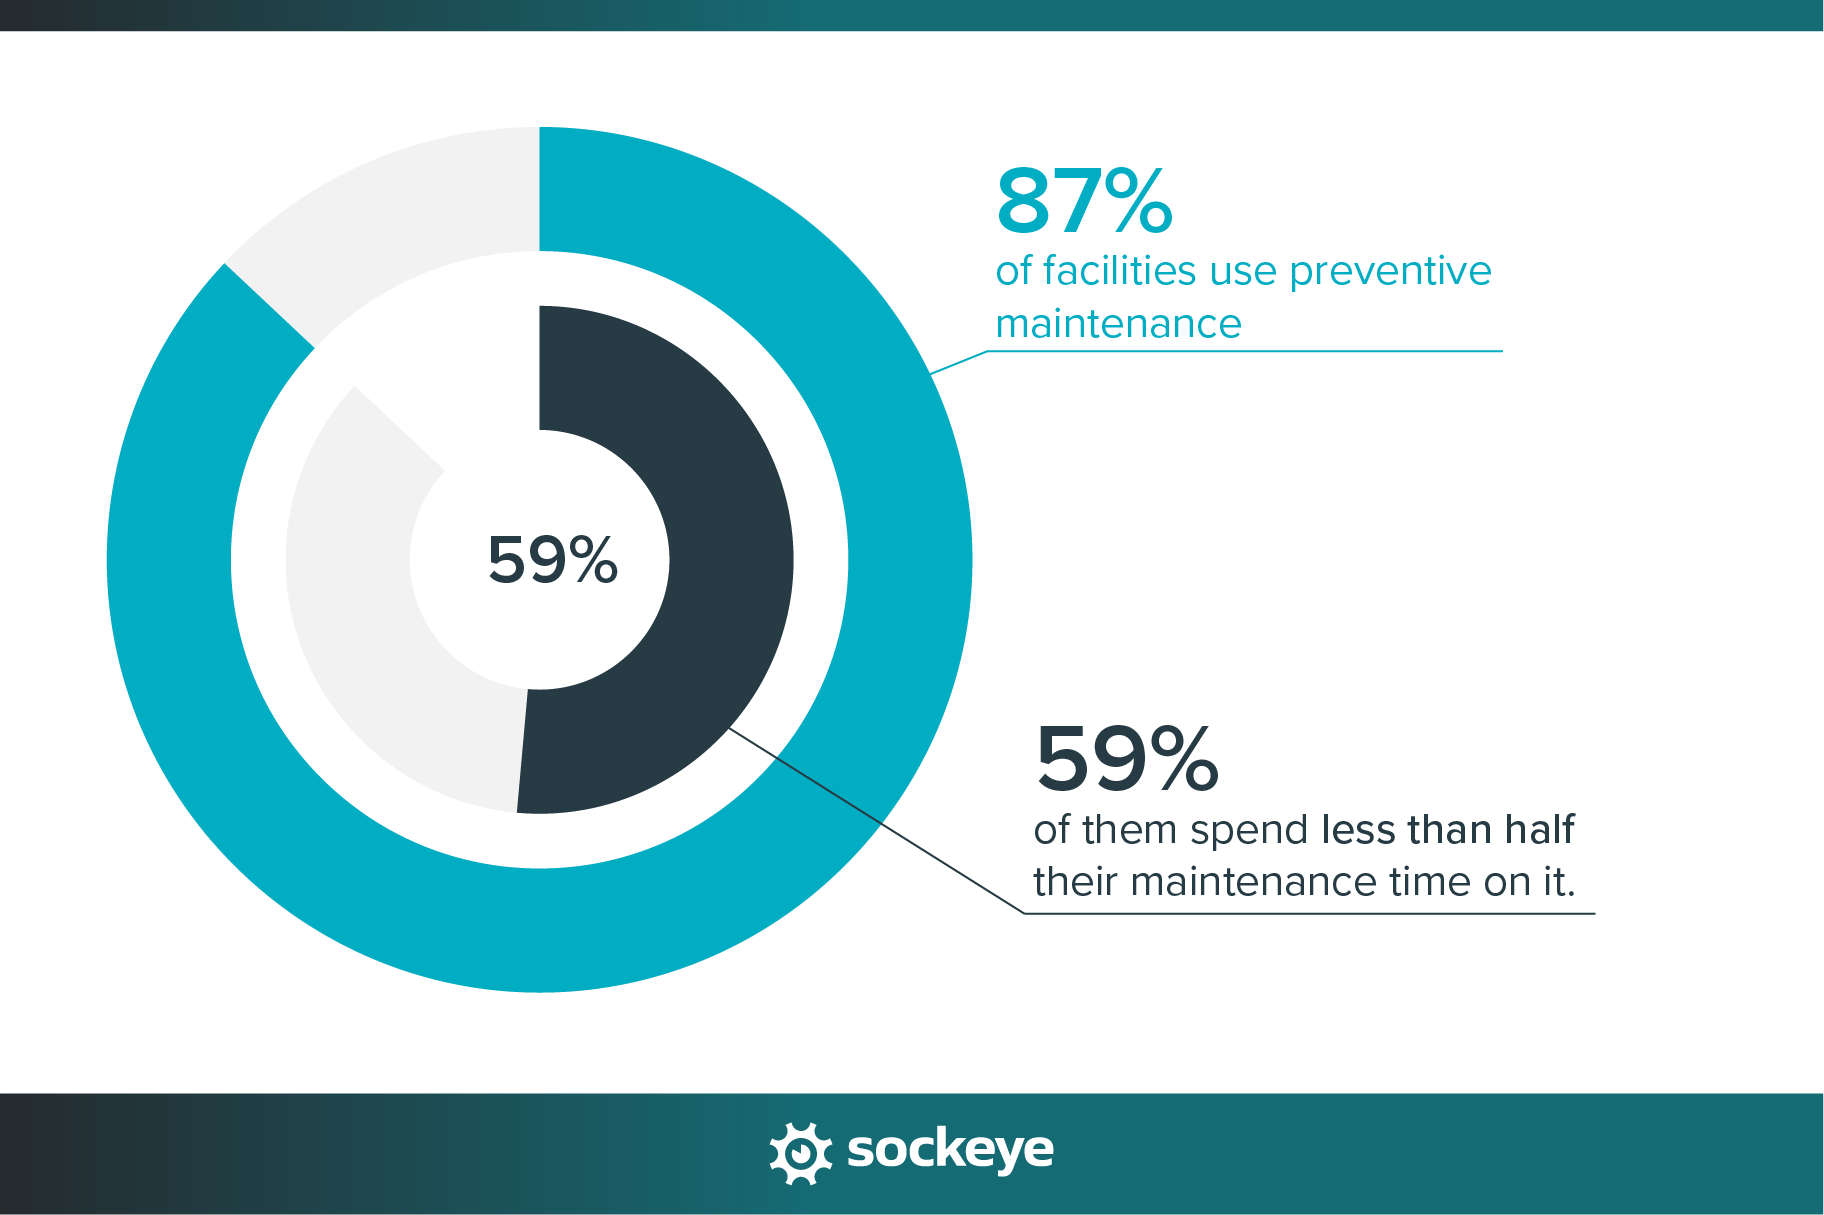
Even though 87% of facilities use preventive maintenance, 59% of them spend less than half their maintenance time on it. That’s a pretty big disconnect. It suggests that while nearly everyone says they’re doing PM, it’s probably in lower volume than they would like. This gap could be due to limited resources, a reactive culture, lack of maintenance planning, or poor scheduling practices.
Other relevant preventive maintenance stats:
- Various reports agree that 80 to 90% of industrial facilities use a preventive maintenance strategy.
- 44% of facilities spend 40+ hours weekly on scheduled maintenance.
- On average, plants spend 33 hours per week on scheduled maintenance.
- 67% of manufacturers are actively implementing preventive maintenance as a way to reduce downtime.
- PM completion is the most commonly tracked maintenance KPI (used by 56% of facilities), followed by work order backlog (53%).
Predictive maintenance statistics
The following stats show just how powerful this approach can be, and why more teams are making the shift.
One stat that stands out:
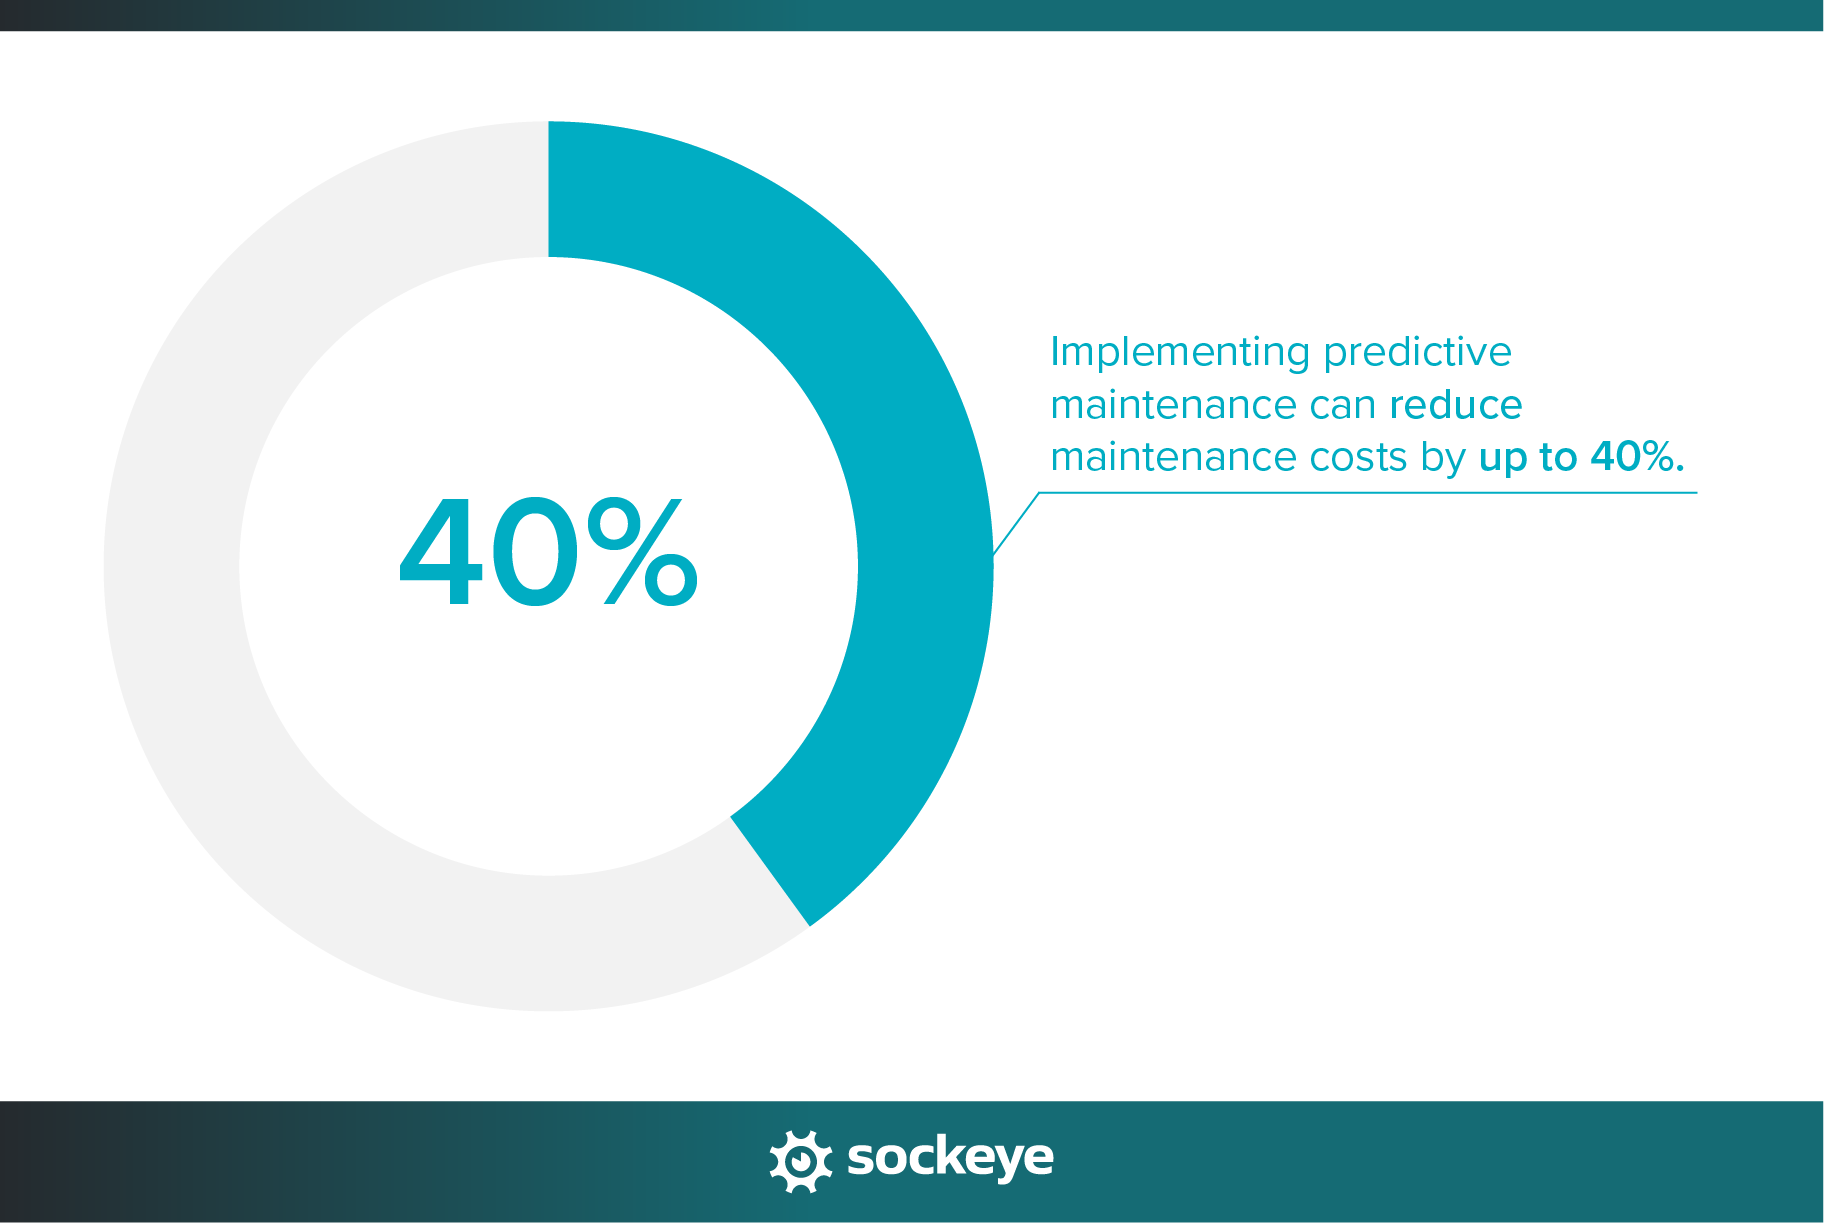
Adopting predictive maintenance can lead to a 40% reduction in maintenance costs. That’s a massive savings potential, especially for large operations. When you pair that with fewer unexpected failures and better use of your maintenance team’s time, the return on investment becomes hard to ignore. However, PdM still remains a big upfront investment.
Other relevant predictive maintenance stats:
- Various reports show that 30 to 40% of industrial facilities are employing some form of predictive maintenance.
- 38% of surveyed facilities have plans to implement predictive maintenance/analytics.
- Implementing PdM helps organizations reduce unplanned machine downtime by up to 50%.
- 85% of teams see improvement in downtime forecasting accuracy after implementing predictive maintenance techniques.
- 55% of plants report an increase in maintenance staff productivity after implementing PdM.
- 70% of surveyed industrial businesses see predictive maintenance as a strategic priority.
- 42% of manufacturers cite downtime reduction as the main reason to implement predictive maintenance.
CMMS-related statistics and technology adoption
Technology is playing a bigger and bigger role in maintenance — and not just flashy new tools. From old CMMS systems to modern maintenance scheduling software to advanced sensors and IoT, companies are finding ways to become smarter, faster, and more proactive.
One stat that stands out:
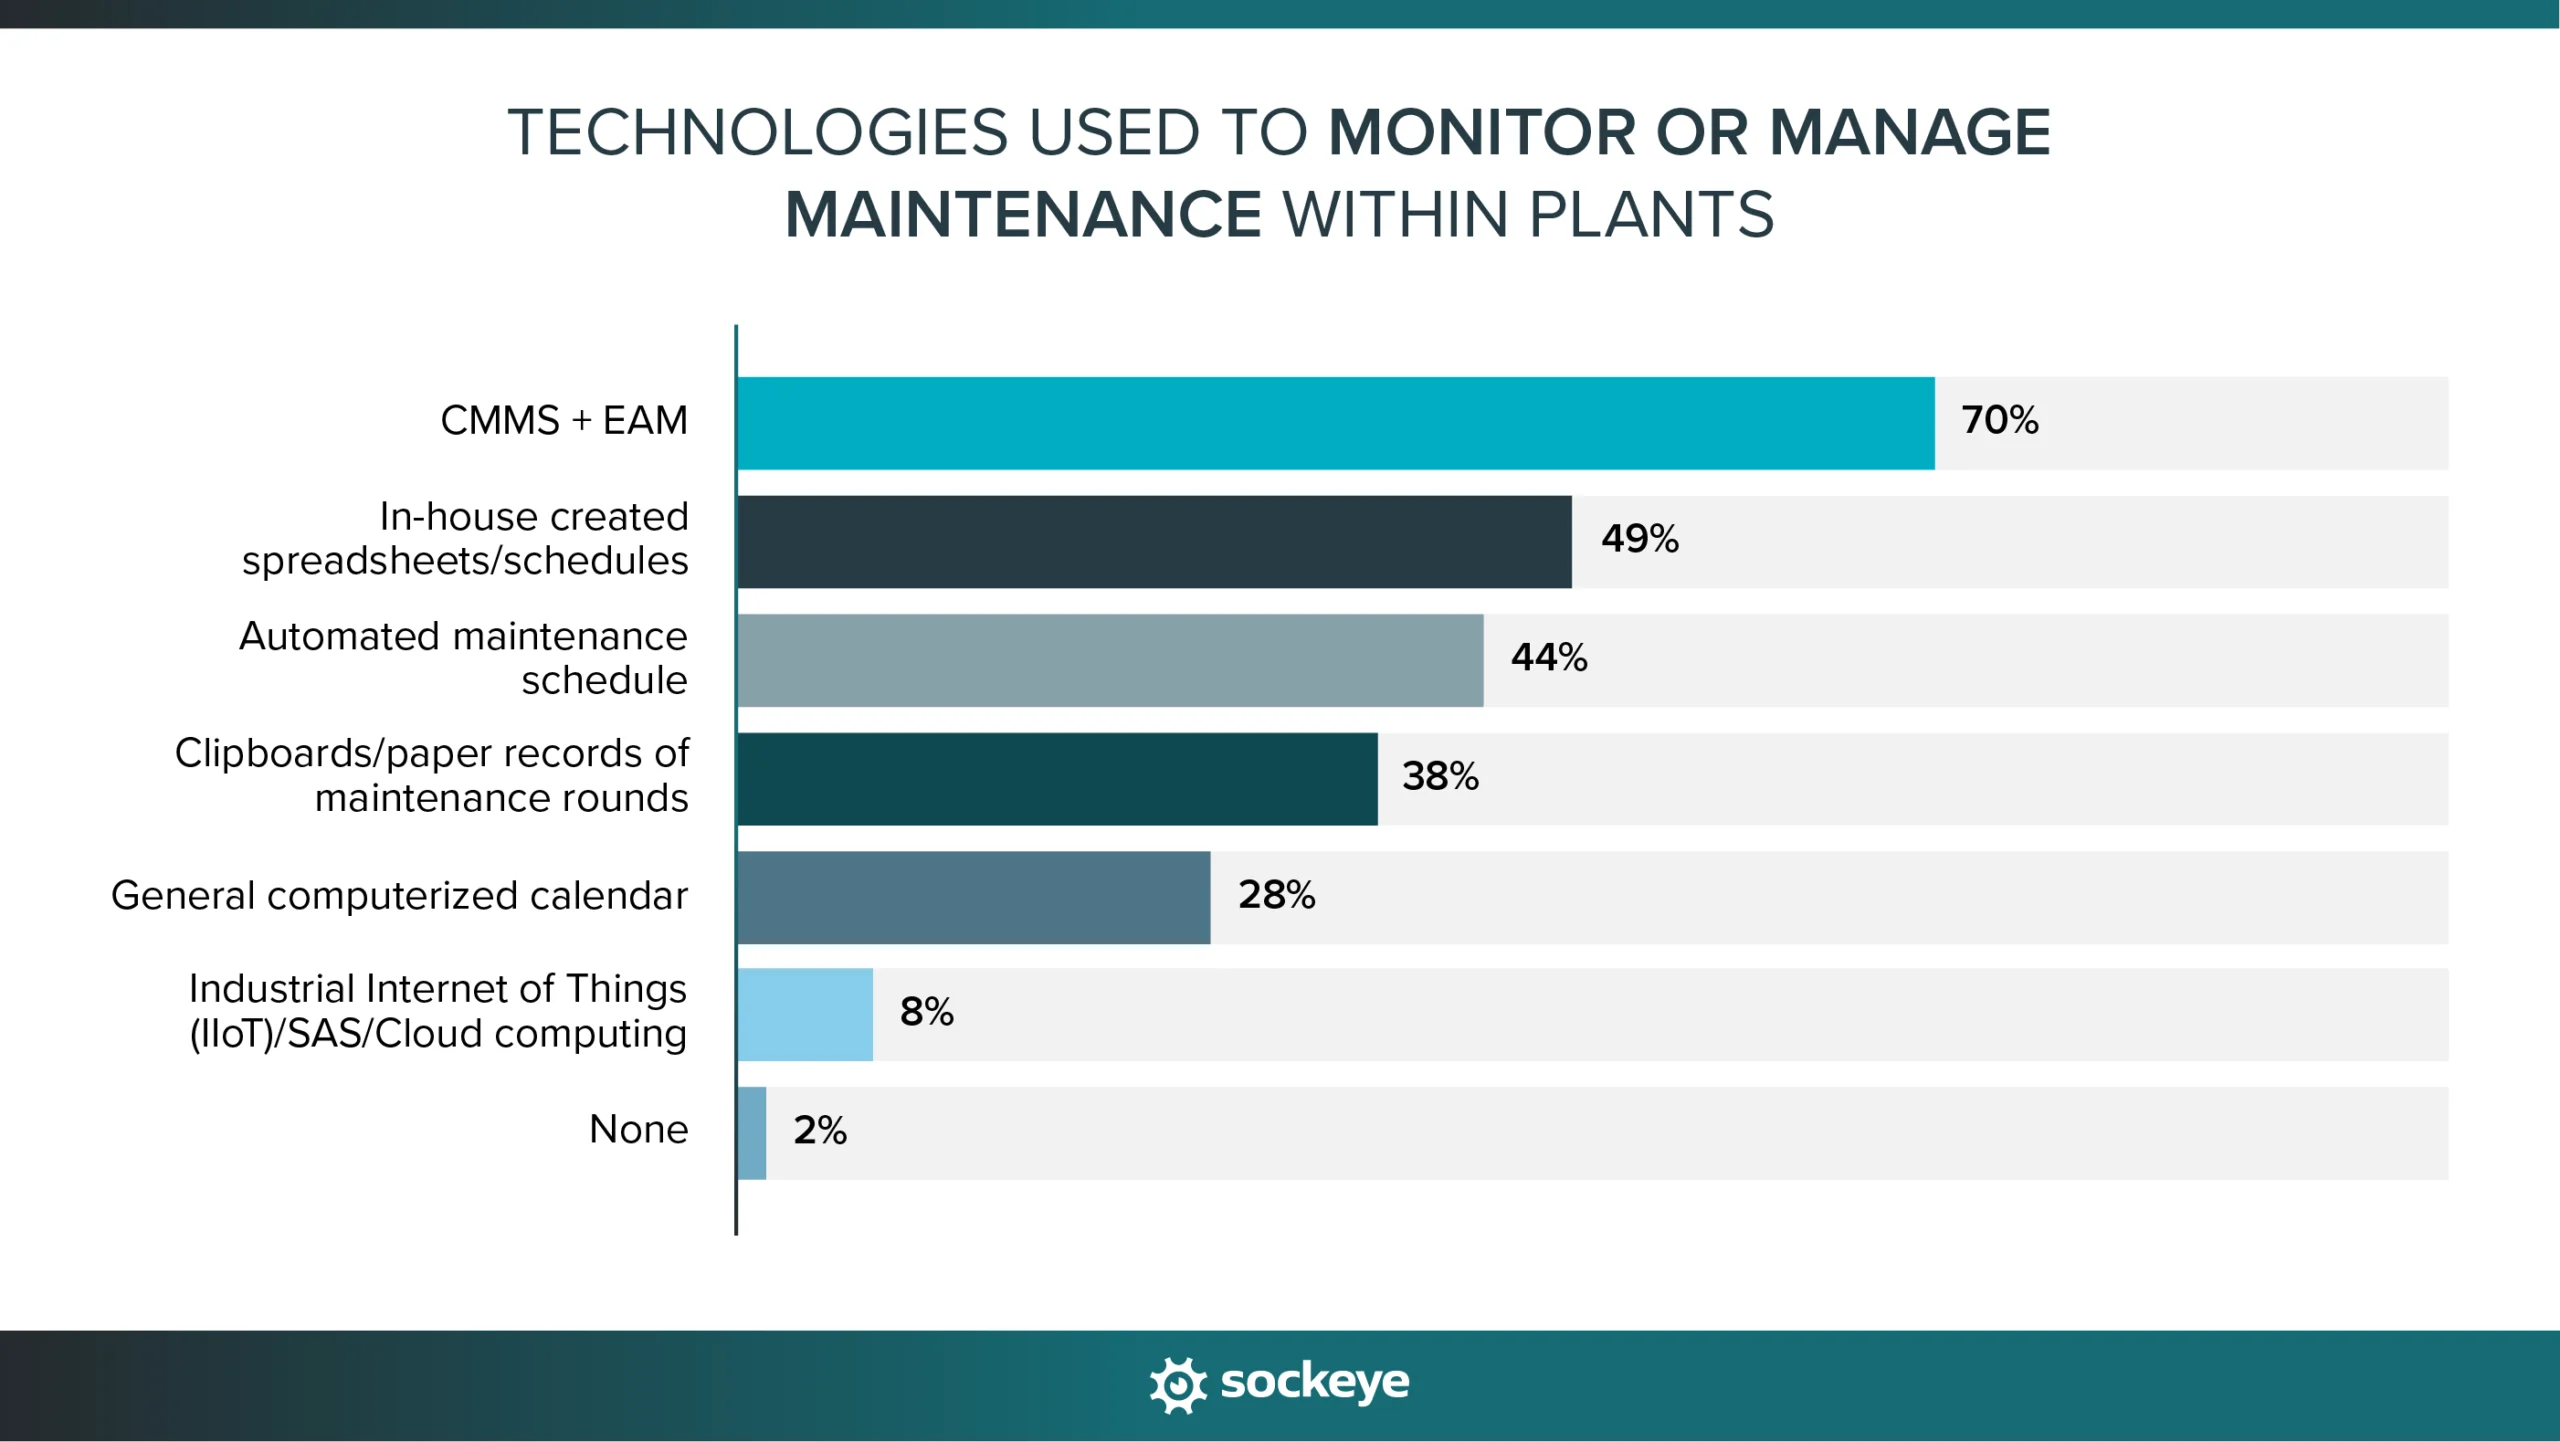
Around 70% of plants have implemented CMMS or EAM. Despite that, 49% still report using in-house-created spreadsheets/schedules. This highlights why more organizations are seeking EAM/CMMS bolt-ons like Sockeye to streamline maintenance scheduling, allowing them to finally eliminate the need to juggle between their CMMS/EAM and Excel.
Other relevant technology adoption stats:
- 48% of facilities already use connected devices to capture and analyze some machine data, with 17% reporting that they are using advanced machine data capture.
- 36% of facilities collect, analyze, and act on machine data through a combination of outsourcing and in-house employees.
- 72% of plants plan to implement new or increase investment in existing technologies.
- 25% of surveyed facilities that do not use it yet have a plan to implement a CMMS.
- 36% of plants plan to use sensors or remote monitoring.
- 47% of plants plan to implement advanced machine data capture in the next 1–3 years. In contrast, 31% have no plans to implement advanced machine data capture.
- 91% of facilities report that they are working to improve their data collection and analysis capabilities.
- 45% of plants are implementing sensor-enabled maintenance, with 33% adopting IoT technology.
- 33% of plants are using virtual and remote maintenance.
Statistics covering maintenance budgets and costs
Maintenance isn’t just about keeping machines running — it’s also about balancing time, labor, and money. These stats show how facilities are budgeting for maintenance, how much they’re actually spending, and where that money tends to go.
One stat that stands out:
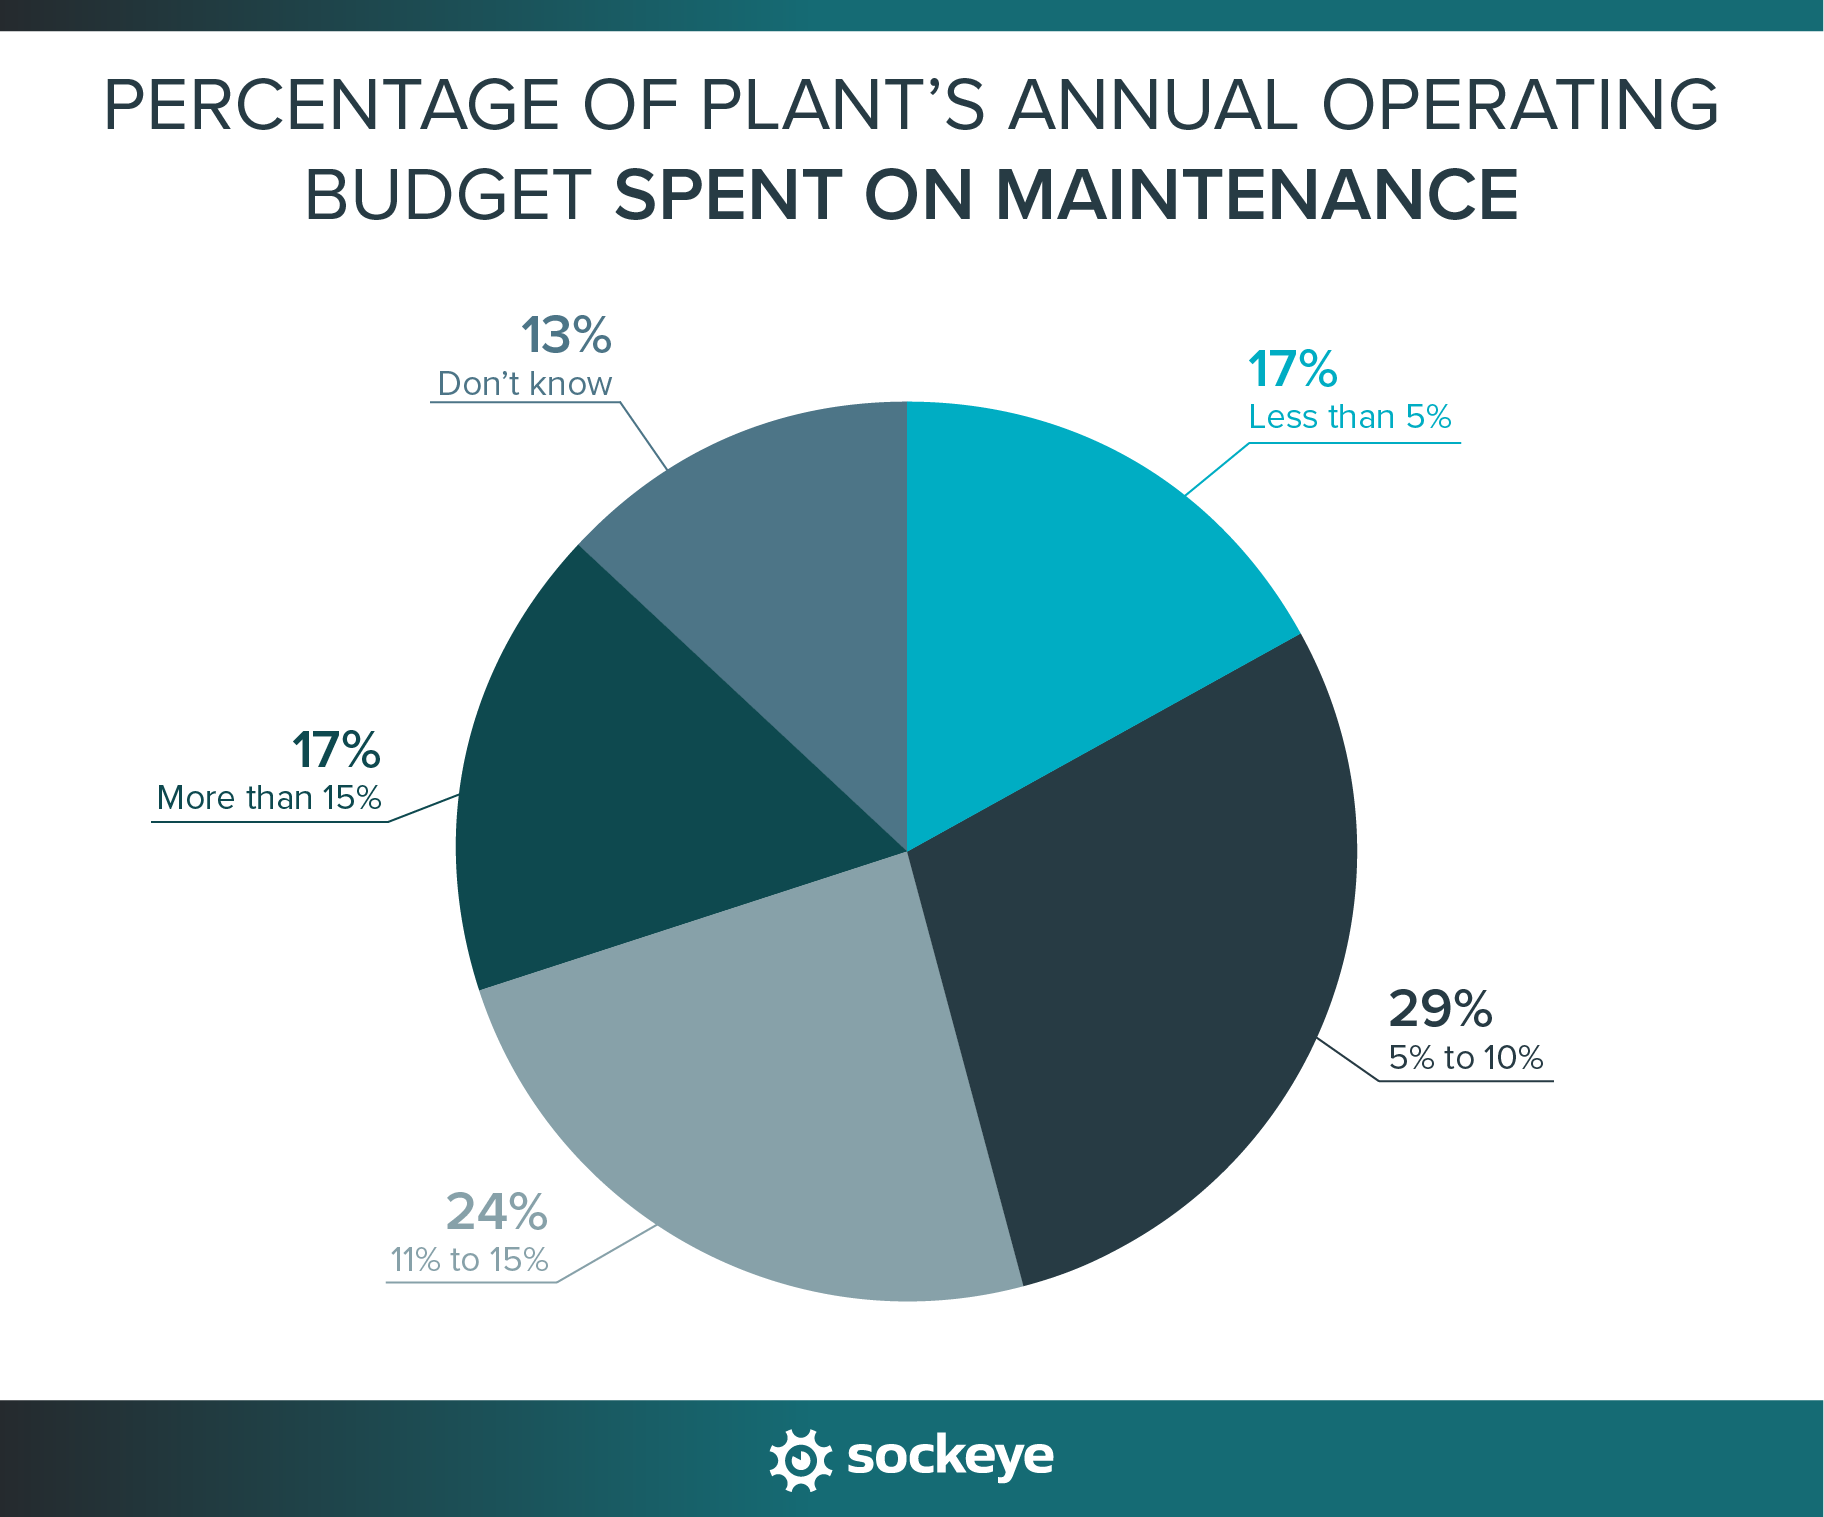
41% of plants allocate more than 10% of their annual operating budget to maintenance tasks, services, and equipment. That’s a big chunk of the budget — and it highlights how critical maintenance is to keeping operations smooth and avoiding costly breakdowns.
Other relevant stats:
- On average, plants spend 10% of their annual operating budget on maintenance.
- 38% of facilities expect their maintenance budget to increase in the next 12 months.
- 29% of facilities are reporting an increase in the financial impact of unplanned disruptions. When unplanned downtime happens, it’s more expensive than ever.
Downtime & manufacturing maintenance statistics
In manufacturing, every minute of downtime can mean serious money lost—and a lot of stress. These stats show how equipment failures, outdated assets, and even small process gaps can ripple through production — and what facilities are doing to fight back.
We have a couple of stats to highlight here:
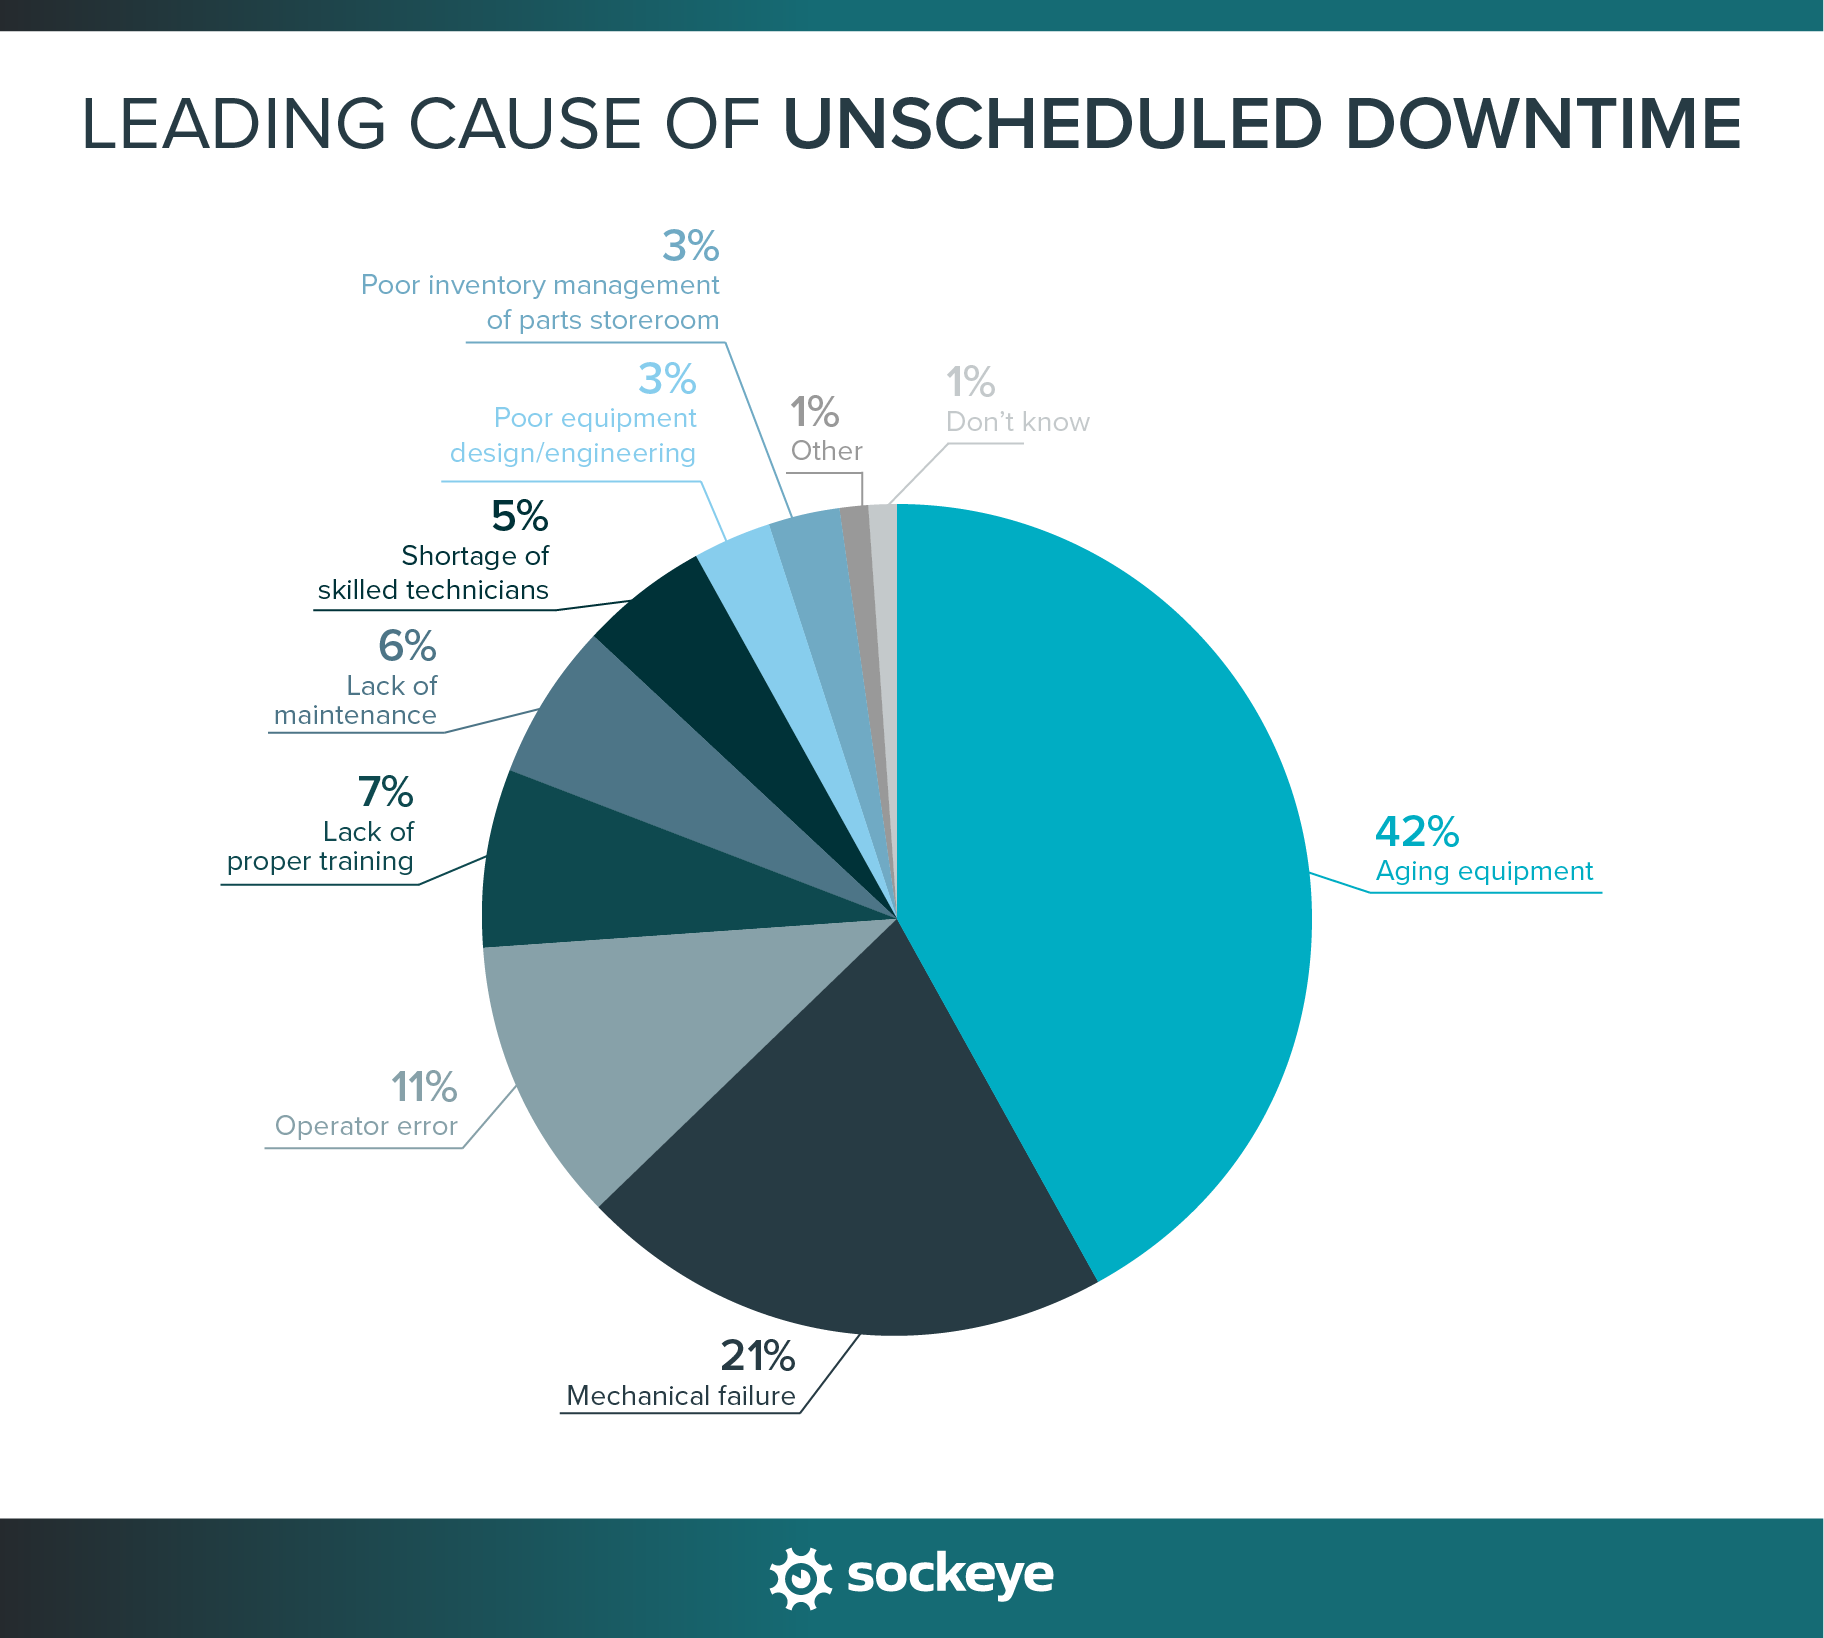
42% of facilities say aging equipment is the top cause of unplanned downtime, followed by mechanical failure (21%) and operator error (11%). As machines get older and production demands rise, reliability naturally takes a hit. This stat makes a strong case for investing in upgrades or increasing asset monitoring to catch wear and tear before it leads to failure.
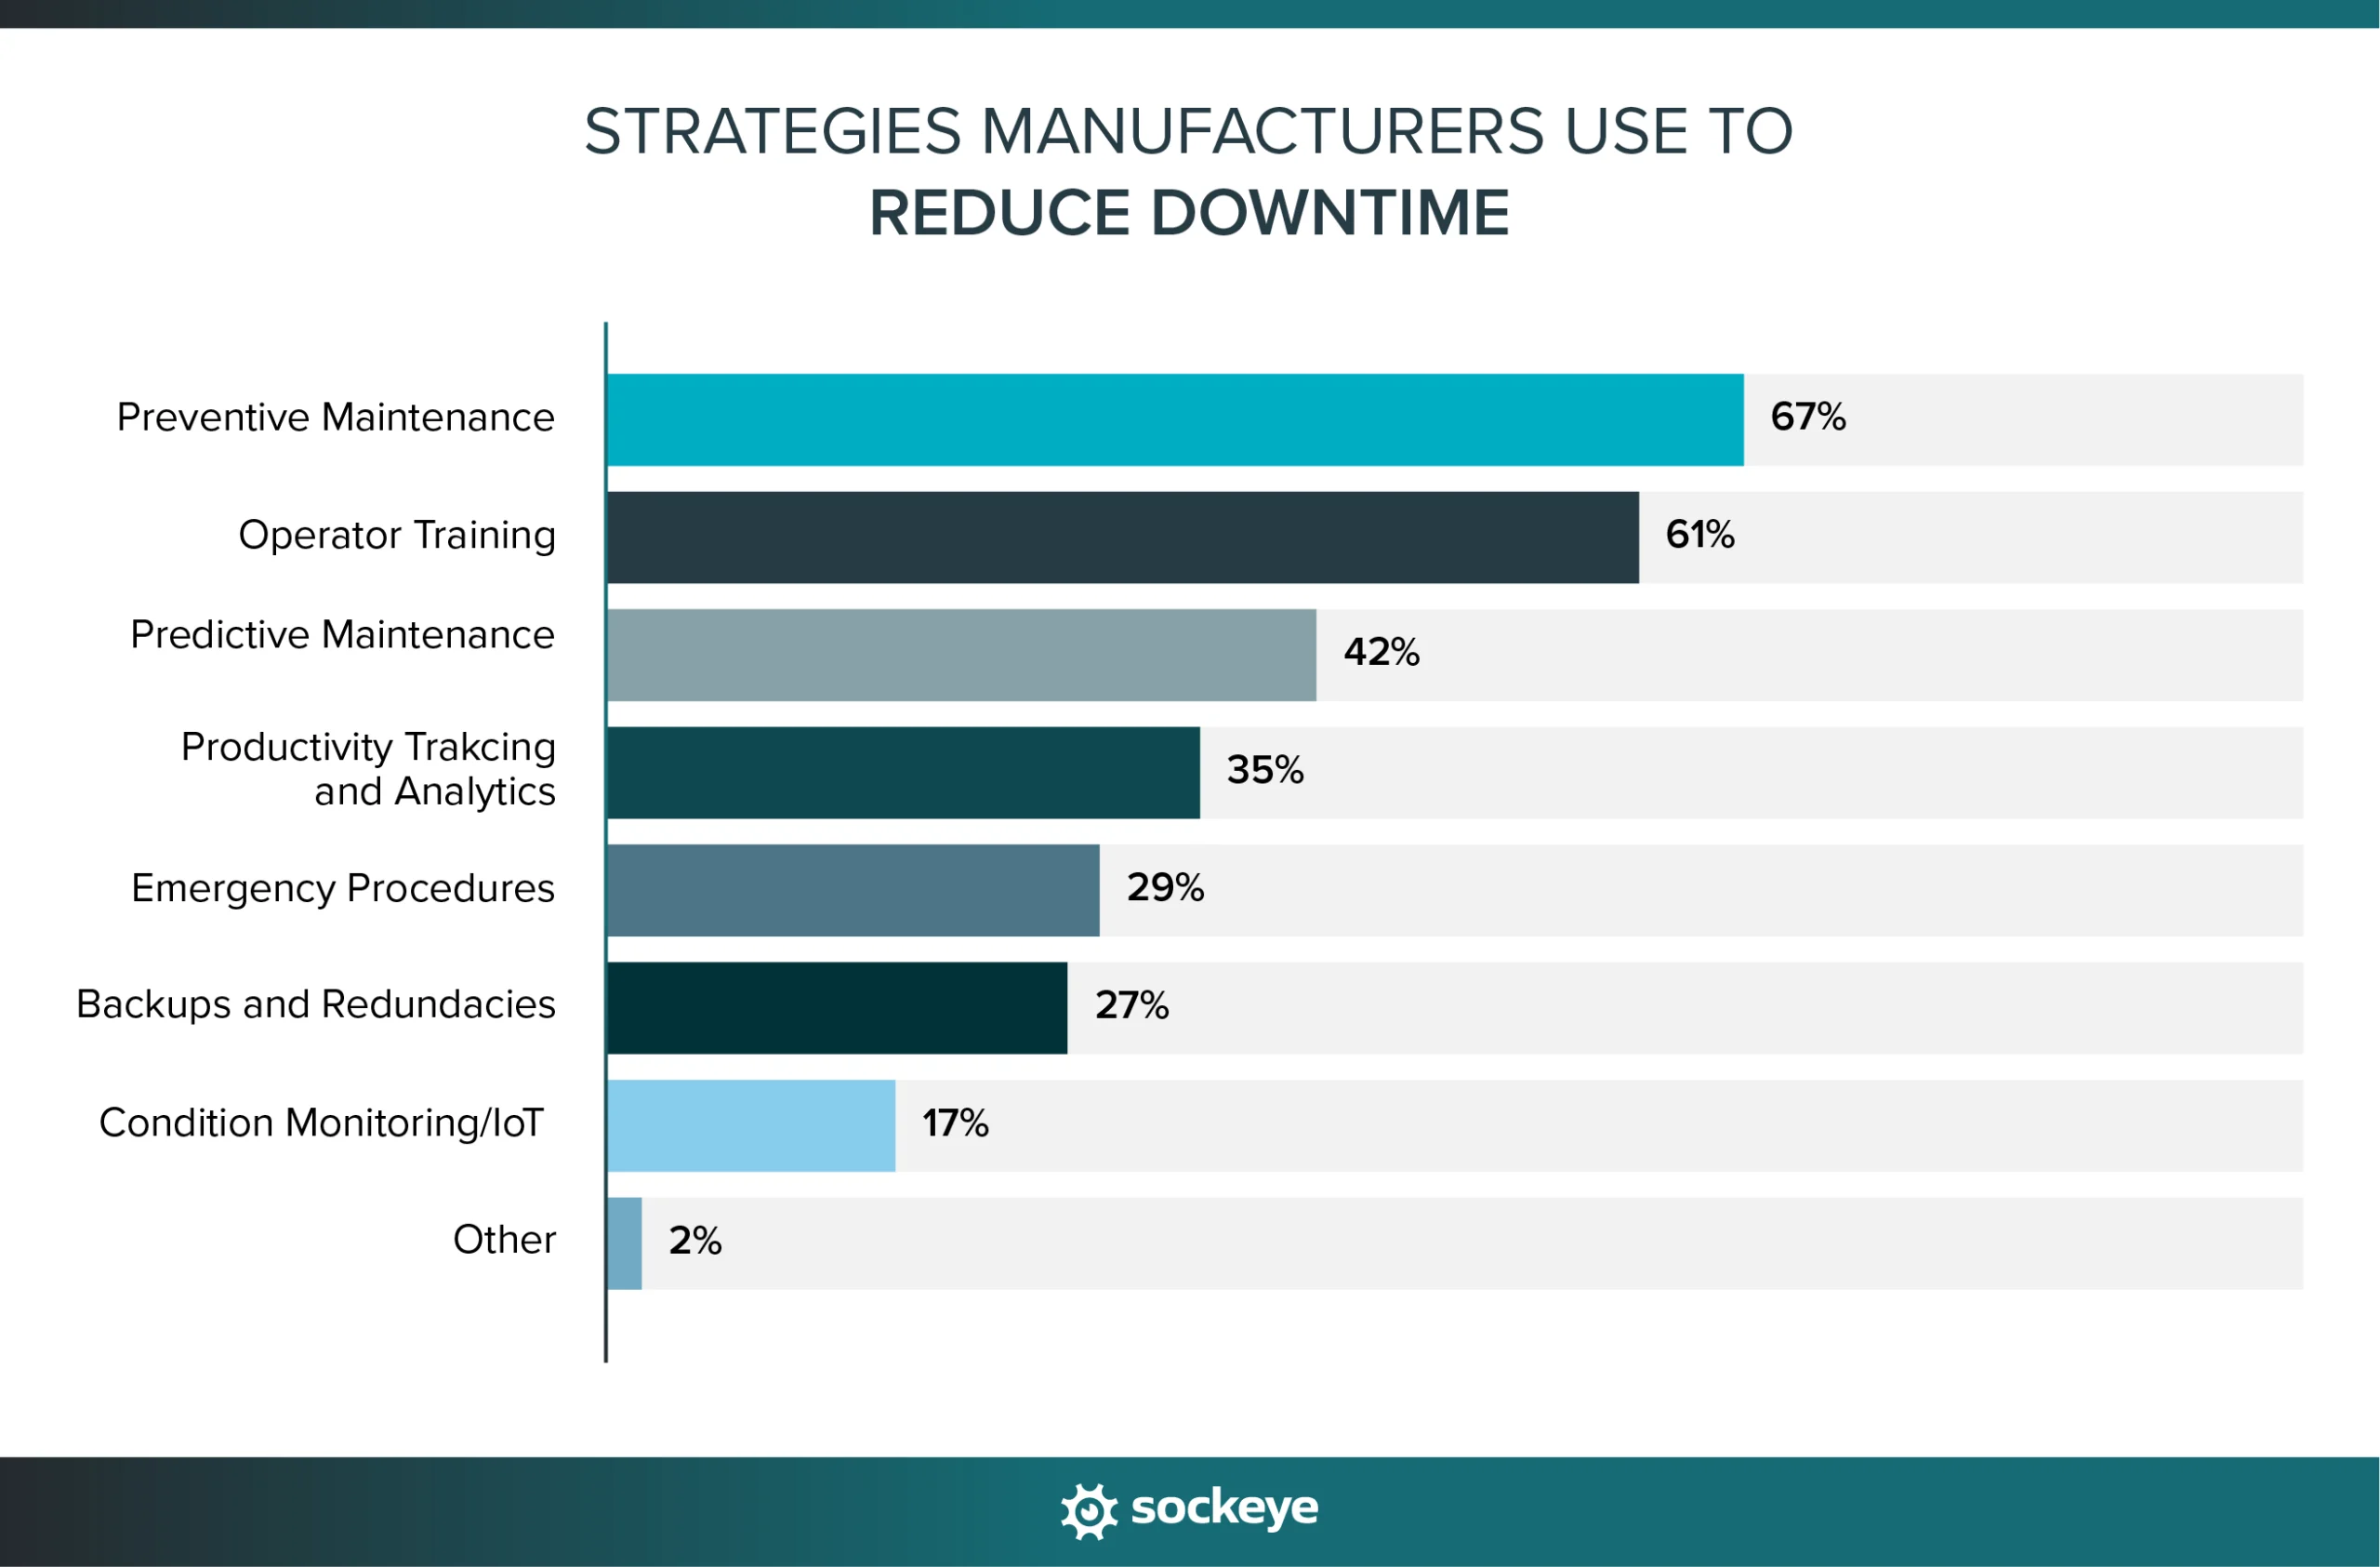
Companies are trying out multiple strategies to decrease downtime. The most common is using preventive maintenance (67%), closely followed by investment in operator training (61%) and predictive maintenance (42%).
Other relevant manufacturing downtime statistics:
- Unplanned downtime costs Fortune Global 500 companies 11% of their yearly turnover.
- The average annual cost of downtime per facility is staggering $129 million.
- The average plant loses 25 hours monthly to unplanned downtime.
- The downtime cost varies widely by industry: from $2 million per hour in the automotive industry to $500,000 per hour in Oil and gas and $39,000 per hour in FMCG (Fast-Moving Consumer Goods).
Final words
Whether that was leadership, tight budgets, or an aging workforce, the maintenance industry has been notorious for its resistance to change. But if we trust these stats, the times are changing. The competitive advantage that technology brings has become too hard to ignore.
Whether you’re fine-tuning your strategy, justifying investments, or looking for ways to boost efficiency, let this data be your ally. Use it, share it, and stay ahead.
SOURCES USED: